Making the green transition visible in South Savo
We developed a geospatial data visualization service related to the green transition for the EU-funded INNOCAP project. The service supports municipal decision-making and includes Mindhive’s AI assistant, which answers users’ questions based on selected data sources.

INNOCAP Project, University of Helsinki
What is the green transition, and how do its related factors map out regionally? This is often hard to grasp due to its conceptual nature. Mindhive approached the development work with an open mind and flexibility, turning researchers' ideas into a concrete, research-based map service for the green transition.

Toni Ryynänen
Senior Researcher
University of Helsinki Ruralia Institute
The goal of the INNOCAP project is to offer high-quality, sustainable public service solutions by supporting the adoption of new innovations and digital technologies. The project aimed to create a service that fosters regional cooperation and the green transition in South Savo. INNOCAP is funded by the European Union’s Northern Periphery and Arctic Programme. The service was designed and implemented in collaboration between the Ruralia Institute at the University of Helsinki and Mindhive.
Learn more
https://www.greensouthsavo.eu/
Where did we start

Need
The INNOCAP project identified the need to create a digital geospatial service for municipal decision-makers to visualize green transition indicators on a map. Additionally, there was a desire to utilize AI in supporting visioning, analyzing strategy and research documents, and collecting research data related to the green transition.
Solution
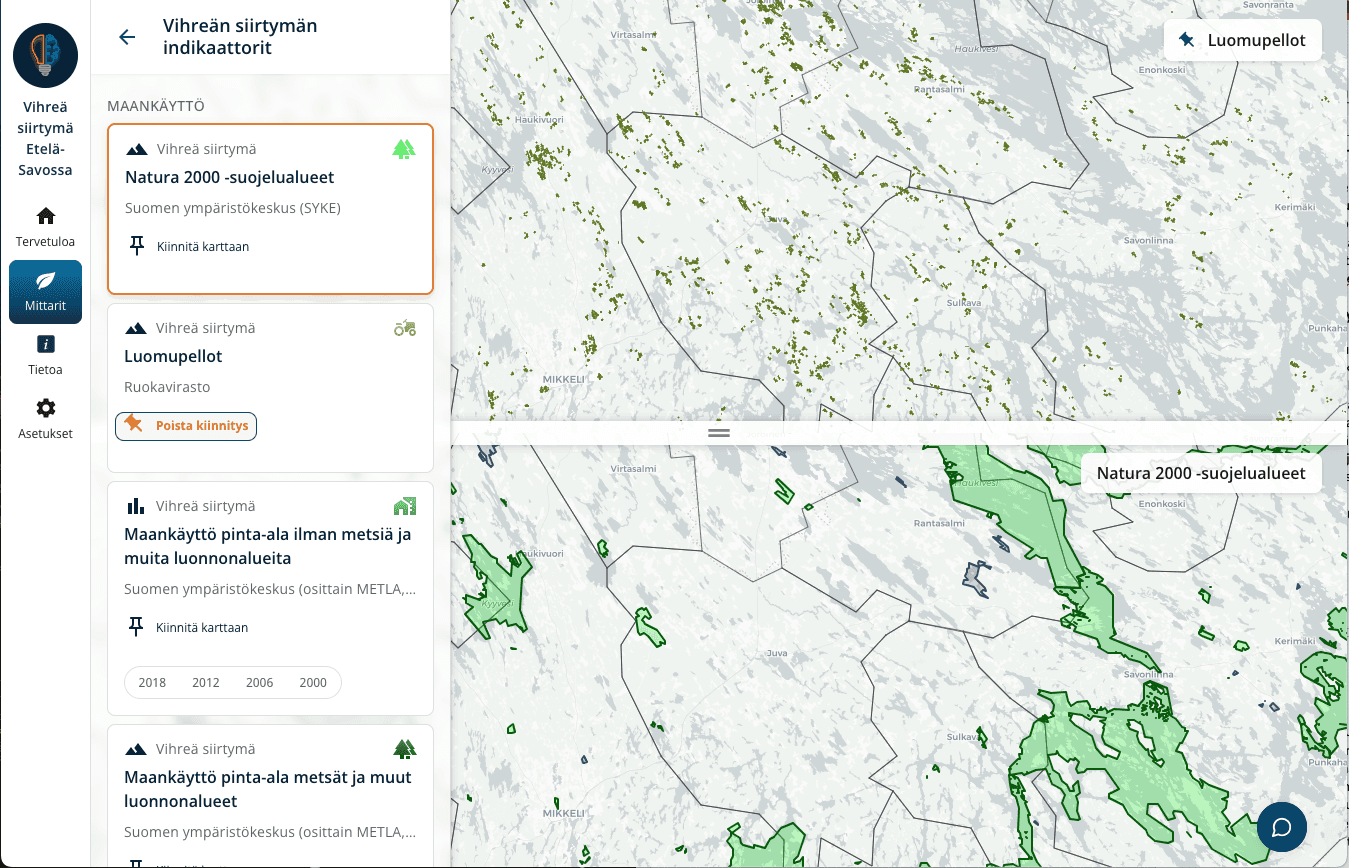
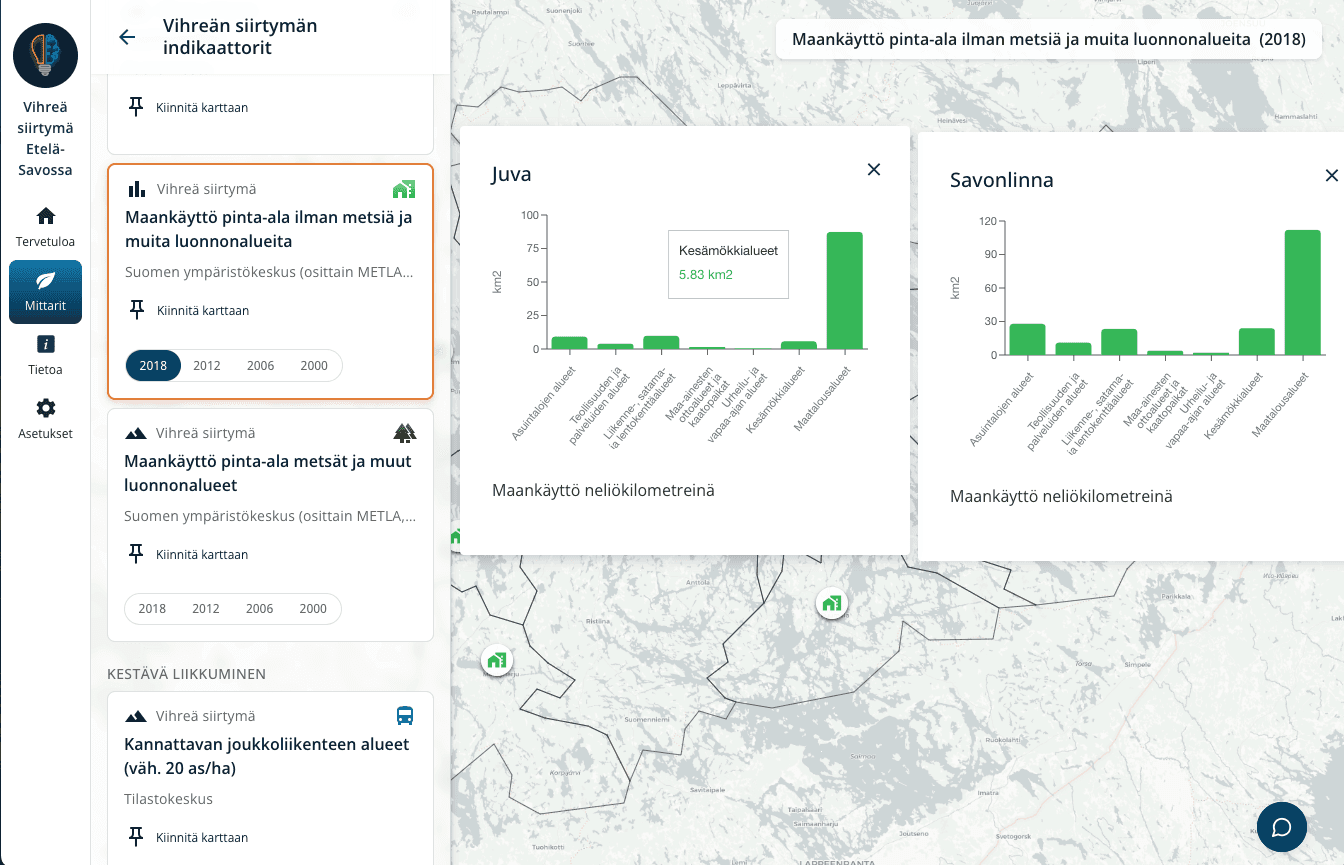
The Green Transition in South Savo service allows users to explore indicators related to the green transition interactively via maps. Users can view and compare indicators across different years. The service also includes an AI assistant that answers users’ questions using selected data sources such as municipal strategies, climate programs, and scientific articles.
The system is designed to be easily maintained and extended. New indicators can be added via Google Sheets without technical modifications, ensuring the service remains user-friendly, adaptable, and up to date.

Need
The INNOCAP project identified the need to create a digital geospatial service for municipal decision-makers to visualize green transition indicators on a map. Additionally, there was a desire to utilize AI in supporting visioning, analyzing strategy and research documents, and collecting research data related to the green transition.
Solution
The Green Transition in South Savo service allows users to explore indicators related to the green transition interactively via maps. Users can view and compare indicators across different years. The service also includes an AI assistant that answers users’ questions using selected data sources such as municipal strategies, climate programs, and scientific articles.
The system is designed to be easily maintained and extended. New indicators can be added via Google Sheets without technical modifications, ensuring the service remains user-friendly, adaptable, and up to date.
AI-powered solutions
User-centered design
Agile development
Geospatial data visualization
How did we do it
A User-Centered Outcome Through Collaboration
The project began with identifying potential users and mapping their needs. This ensured the service would meet real challenges in municipal decision-making. Functional and non-functional requirements were defined collaboratively with the client.
The service was developed using an agile model consisting of four two-week sprints. After each sprint, the client tested the new features and provided feedback. This iterative process allowed continuous refinement based on real user input.
Maps and AI Making the Green Transition Visible
We chose Leaflet, an open-source library for interactive map visualizations, as the core mapping technology. Leaflet plugins were used to create rich thematic maps and regional colorings. Visualizations were designed to support comparing green transition indicators across time.
The context-aware AI assistant, based on Mindhive’s Mainio platform, provides users with answers based on a wide range of public data sources. The assistant is tailored to offer analyses and development ideas related to the green and digital transitions.

What did our customer get
Green transition visibility
The service makes municipal indicators of the green transition easier to understand and access. Also the service provides data that supports scientific research and regional development.
Easy maintanance
Administrators can update or add indicators via Google Sheets without technical changes.

Do you have an idea for a digital service? Get in touch and let’s explore how to bring it to life.
INNOCAP Project, University of Helsinki
What is the green transition, and how do its related factors map out regionally? This is often hard to grasp due to its conceptual nature. Mindhive approached the development work with an open mind and flexibility, turning researchers' ideas into a concrete, research-based map service for the green transition.
Toni Ryynänen
Senior Researcher
University of Helsinki Ruralia Institute
The goal of the INNOCAP project is to offer high-quality, sustainable public service solutions by supporting the adoption of new innovations and digital technologies. The project aimed to create a service that fosters regional cooperation and the green transition in South Savo. INNOCAP is funded by the European Union’s Northern Periphery and Arctic Programme. The service was designed and implemented in collaboration between the Ruralia Institute at the University of Helsinki and Mindhive.
Learn more
https://www.greensouthsavo.eu/
Where did we start
Need
The INNOCAP project identified the need to create a digital geospatial service for municipal decision-makers to visualize green transition indicators on a map. Additionally, there was a desire to utilize AI in supporting visioning, analyzing strategy and research documents, and collecting research data related to the green transition.
Solution
The Green Transition in South Savo service allows users to explore indicators related to the green transition interactively via maps. Users can view and compare indicators across different years. The service also includes an AI assistant that answers users’ questions using selected data sources such as municipal strategies, climate programs, and scientific articles.
The system is designed to be easily maintained and extended. New indicators can be added via Google Sheets without technical modifications, ensuring the service remains user-friendly, adaptable, and up to date.
AI-powered solutions
User-centered design
Agile development
Geospatial data visualization
How did we do it
A User-Centered Outcome Through Collaboration
The project began with identifying potential users and mapping their needs. This ensured the service would meet real challenges in municipal decision-making. Functional and non-functional requirements were defined collaboratively with the client.
The service was developed using an agile model consisting of four two-week sprints. After each sprint, the client tested the new features and provided feedback. This iterative process allowed continuous refinement based on real user input.
Maps and AI Making the Green Transition Visible
We chose Leaflet, an open-source library for interactive map visualizations, as the core mapping technology. Leaflet plugins were used to create rich thematic maps and regional colorings. Visualizations were designed to support comparing green transition indicators across time.
The context-aware AI assistant, based on Mindhive’s Mainio platform, provides users with answers based on a wide range of public data sources. The assistant is tailored to offer analyses and development ideas related to the green and digital transitions.
What did our customer get

Green transition visibility
The service makes municipal indicators of the green transition easier to understand and access. Also the service provides data that supports scientific research and regional development.
Easy maintanance
Administrators can update or add indicators via Google Sheets without technical changes.
Do you have an idea for a digital service? Get in touch and let’s explore how to bring it to life.